Webinar: Atmospheric Sciences. The Paso del Norte Air Basin and Beyond

|
Dr. Rosa M. Fitzgerald
Atmospheric Physics Studies in the PdN Region (Click to download presentation) |

|
Dr. William Stockwell
New Chemical Approaches for Air Quality Modeling (Click to download presentation) |

|
Dr. Nakul Karle
Meteorological factors Influencing Air Quality: Multi-scale atmospheric circulations and Virga precipitation |
project Description
The immediate proximity of Ciudad Juárez and El Paso, together with a complex topography, makes apportionment of air pollution challenging. Ceilometer data, which provides planetary boundary layer heights (PBLHs), in conjunction with other meteorological and air quality data (e.g. aerosol backscatter), help determine the local transport of pollutants across the border and support future required meteorological modeling. Measuring the PBLHs, together with other meteorological parameters, is key to understanding and ultimately mitigating ground-level ozone.
A ceilometer measures the cloud-base height and the PBLHs. The PBLH data are important for understanding air pollution development, transport and dispersion, which are integral to modeling and forecasting of ozone and particulate matter.
A ceilometer measures the cloud-base height and the PBLHs. The PBLH data are important for understanding air pollution development, transport and dispersion, which are integral to modeling and forecasting of ozone and particulate matter.
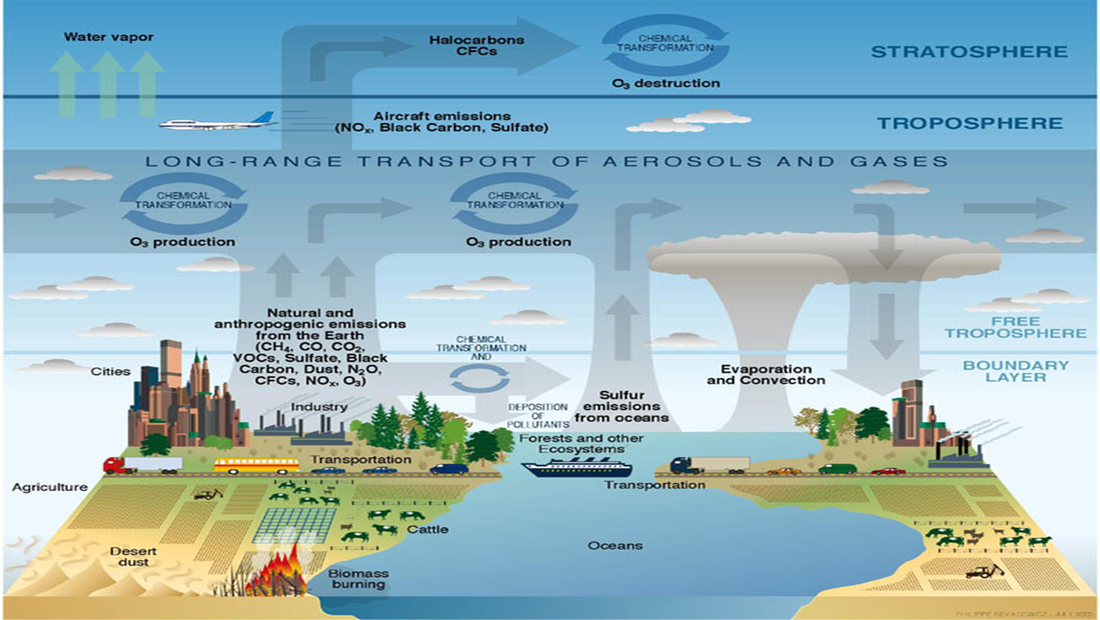
“The Planetary Boundary Layer (PBL) is that part of the troposphere that is directly influenced by the presence of the Earth’s surface, and responds to surface forcings with a timescale of about an hour or so.”
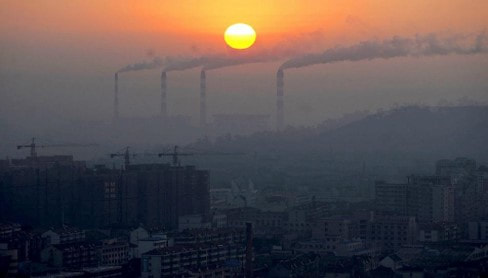
A picture of an industrial city (Shangai, China) illustrating how the PBL
traps pollutants below it.
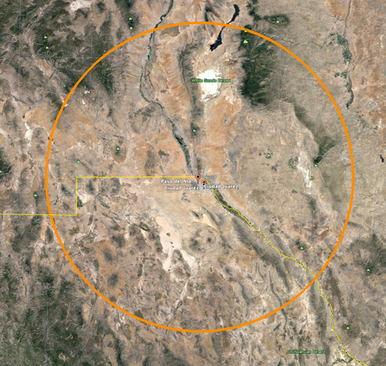
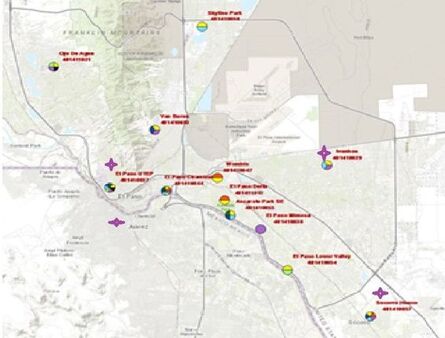
Map of Paso del NORTE NETWORK Ceilometer LOCATION
|
|
oUR CEILOMETERS
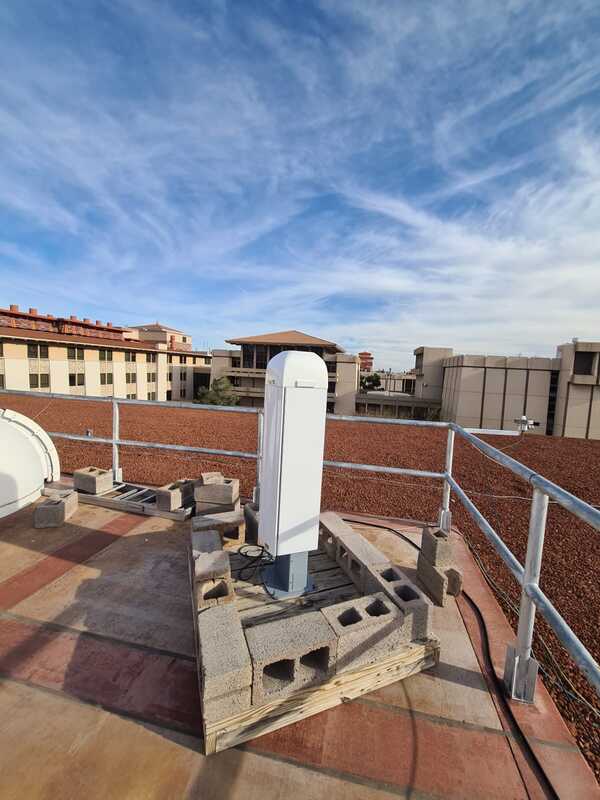
Vaisala C51 located in UTEP, El Paso, Texas
|
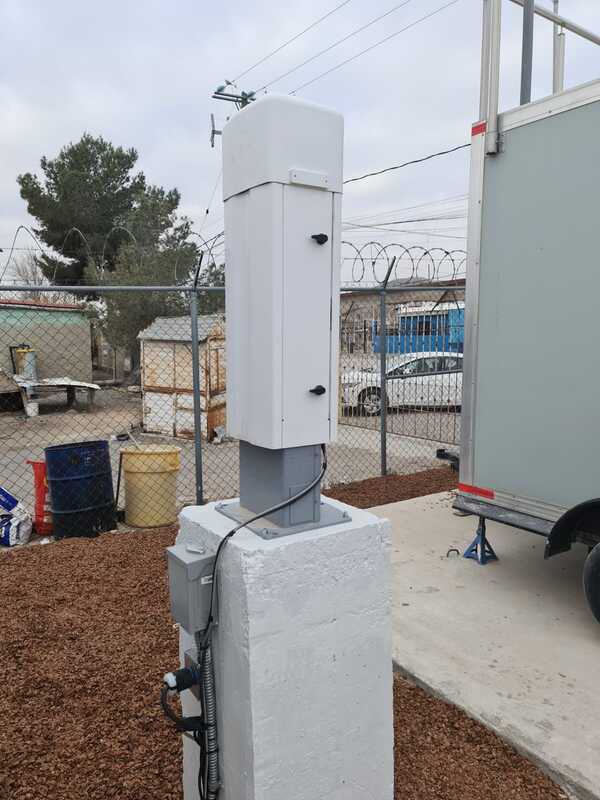
Ceilometer C31 located in Juárez, Chihuahua
|
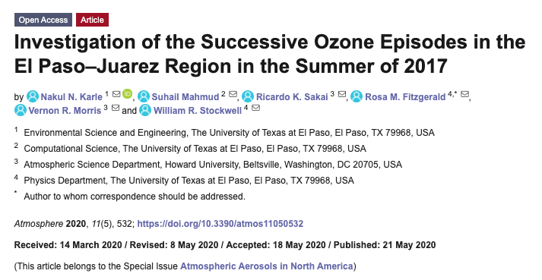
PUBLICATIONS
pbl impacts
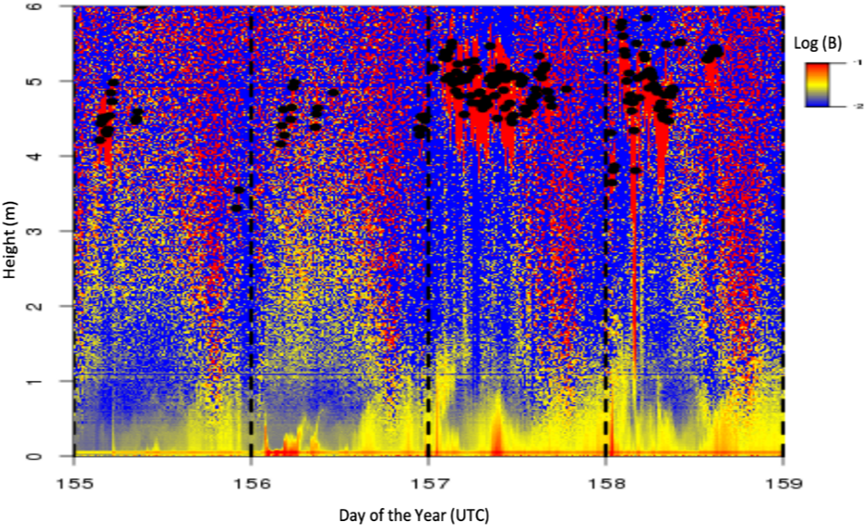
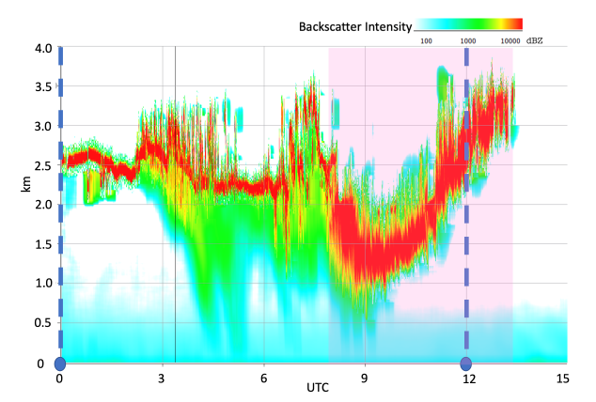
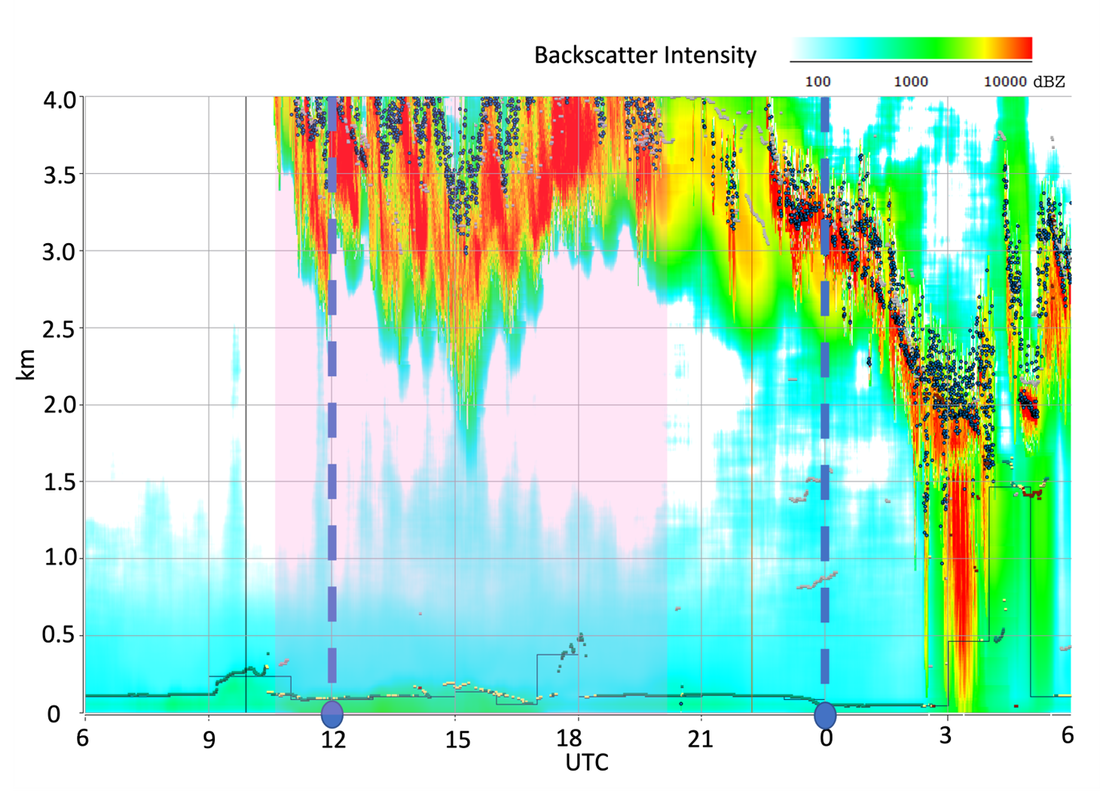
Aerosol backscatter plot for all four high ozone days showing the shallow aerosol layer, June 4-7, 2017.
|
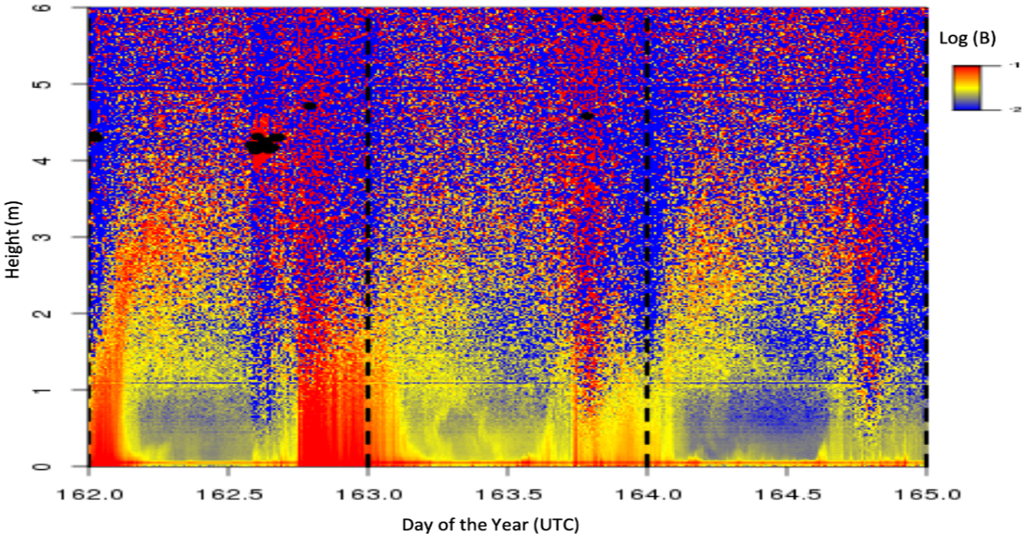
Aerosol backscatter during all three low ozone days showing the deep aerosol layer, June 11-13, 2017
|
Meteorological Drivers of Ozone Episodes
|
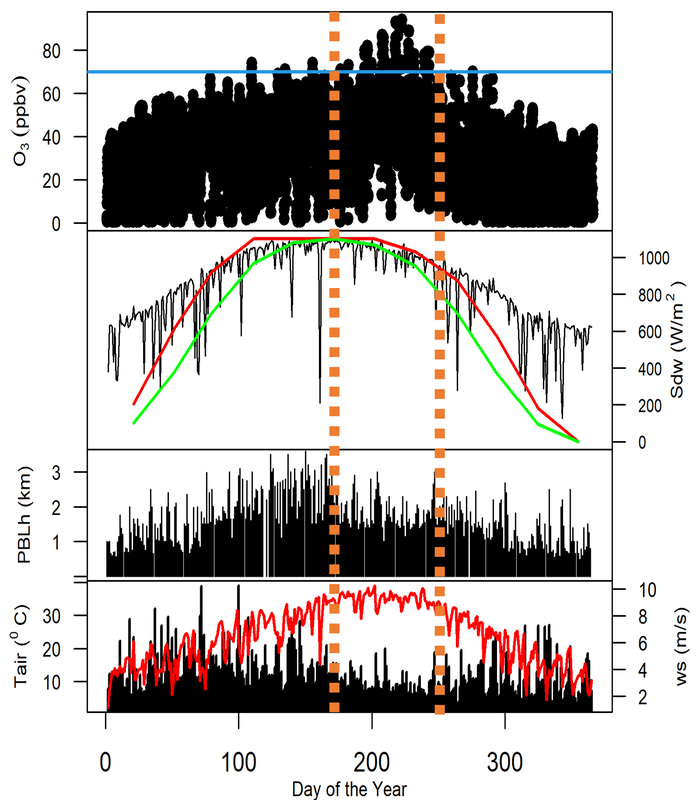
1. Daily hourly ozone concentration in ppbv (top, 1); 2. downward solar radiation (Sdw), photolysis
frequencies of NO2 (red) and O3 (green) , 3. maximum daily PBLH in (km), and 4. afternoon
average wind speeds in black and daily maximum air temperature in red, for the year 2019.
The blue line at the top marks the 71 ppbv of ozone level.
|
Virga Studies Using Ceilometers
|
|
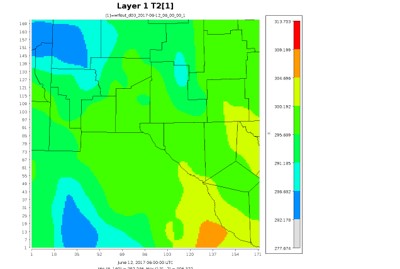
MODEL SIMULATIONS
Publication:
Suhail Mahmud, Nakul Karle, Rosa M. Fitzgerald, Duanjun Lu, Nicholas Nalli, William R. Stockwell, Intercomparison of Sonde, WRF/CAMx and Satellite Sounder Profile Data for the Paso Del Norte Region”, Aerosol Science and Engineering,4, 277-292, 2020.
Suhail Mahmud, Nakul Karle, Rosa M. Fitzgerald, Duanjun Lu, Nicholas Nalli, William R. Stockwell, Intercomparison of Sonde, WRF/CAMx and Satellite Sounder Profile Data for the Paso Del Norte Region”, Aerosol Science and Engineering,4, 277-292, 2020.
|
|
aKNOWLEDGMENTS

|
UTEP:
Dr. Rosa Fitzgerald, Prinicipal investigator Dr. Nakum Karle |
|
UACJ:
Dr. Adrián F. Vázquez Gálvez Mta. Yazmín G. Hernández Ing. Frida Y. Toquinto Manjarrez Adrián V. Peña López |